Your packaging
is leaking margin.
We fix that.
Margin Lab recovers 15–30% of packaging spend as gross profit for D2C brands — by engineering the supply chain, not just finding cheaper quotes.
Most D2C brands are leaving 15–30% of packaging spend on the table every year.
It doesn't show up as a line item. It accumulates silently across four categories — and compounds with every order you place.
Supplier pricing drift
10–15%Most brands haven't benchmarked their supplier pricing in 12+ months. The market moves quietly. Average gap: 10–15%.
Inefficient MOQs
5–9%Too-large orders tie up cash in slow-moving stock. Too-small orders trigger a unit cost premium. Either way, you lose.
Freight structure
8–14%Wrong incoterms, reactive air freight, and unconsolidated shipments add 8–20% to your true cost of goods.
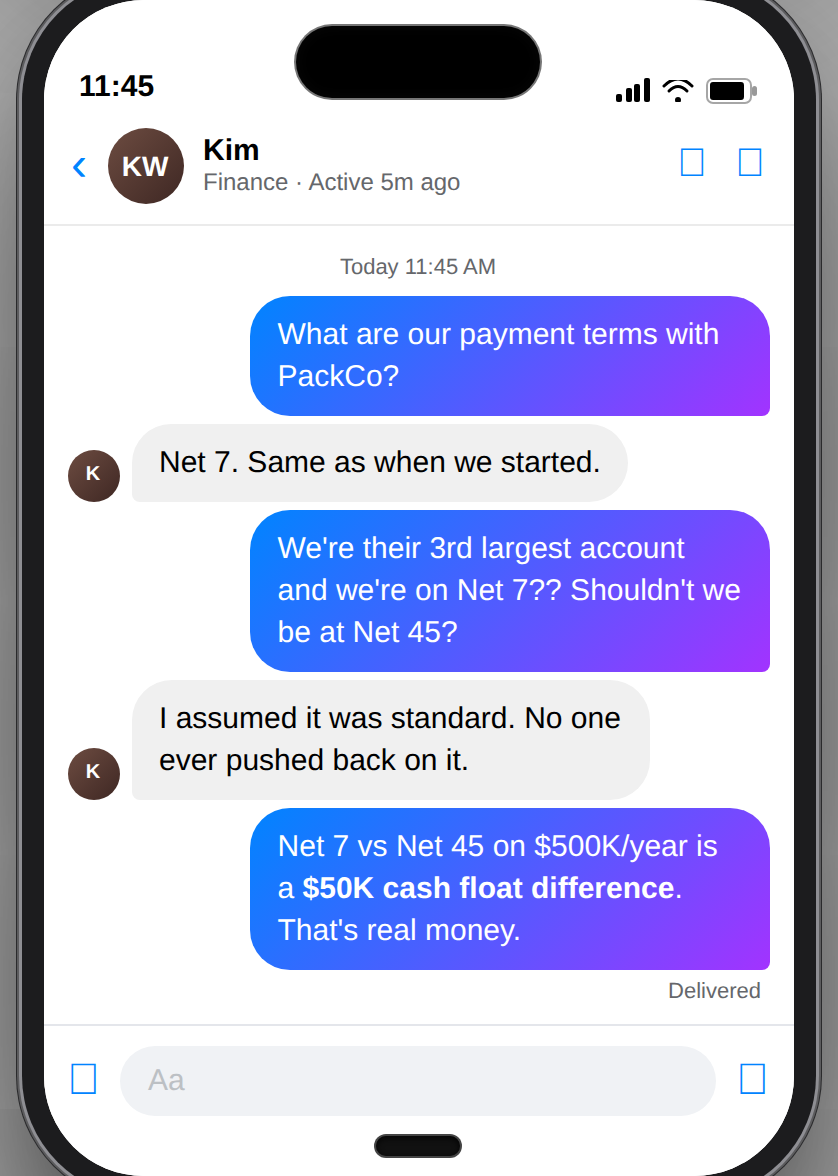
Payment terms
2–4%Paying upfront or net-15 when net-60 is standard? You're financing your supplier's operations with your working capital.
That's $100,000 in recoverable gross profit — every year — hiding inside your "cost of goods" line.
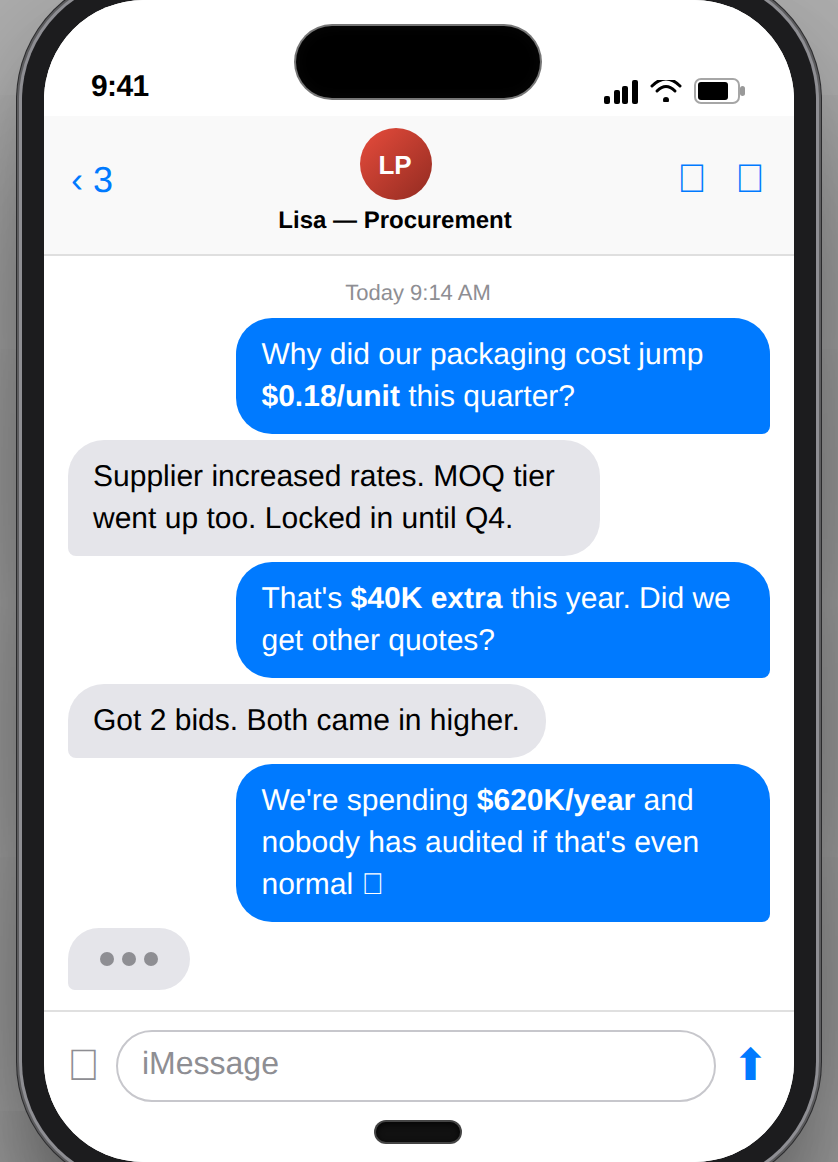
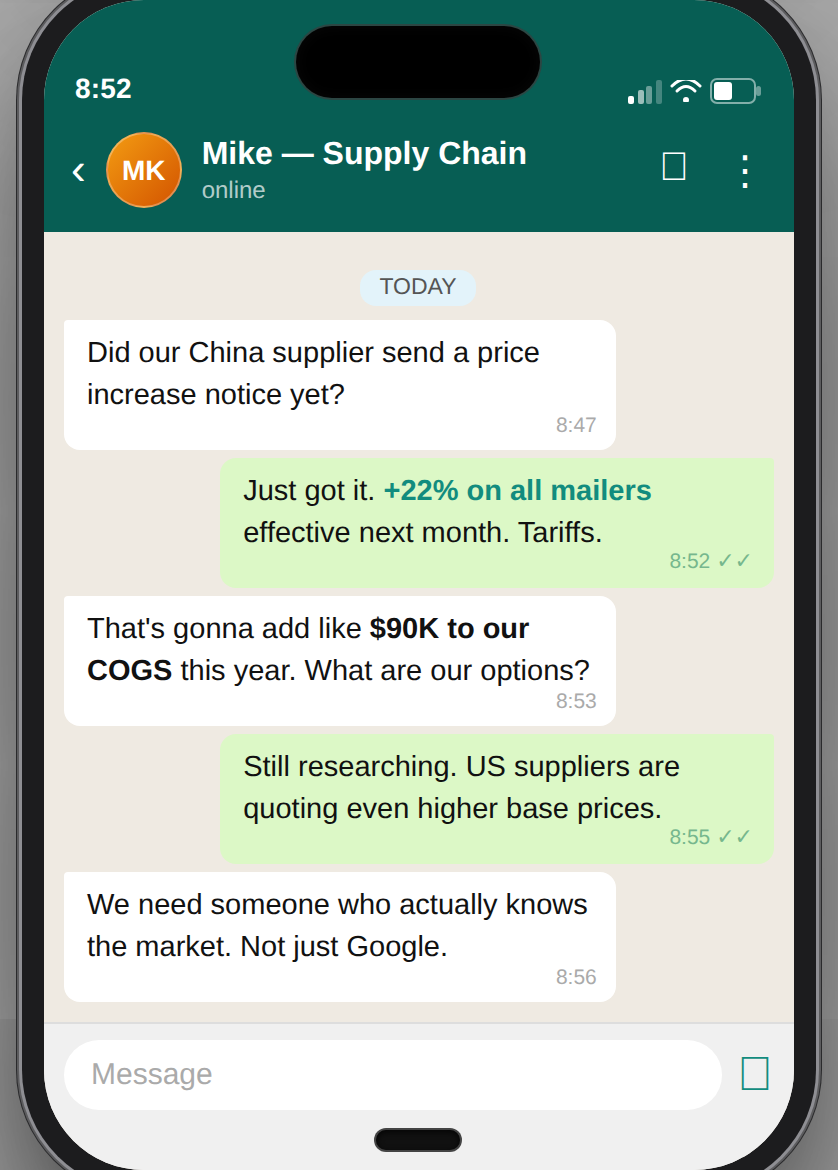
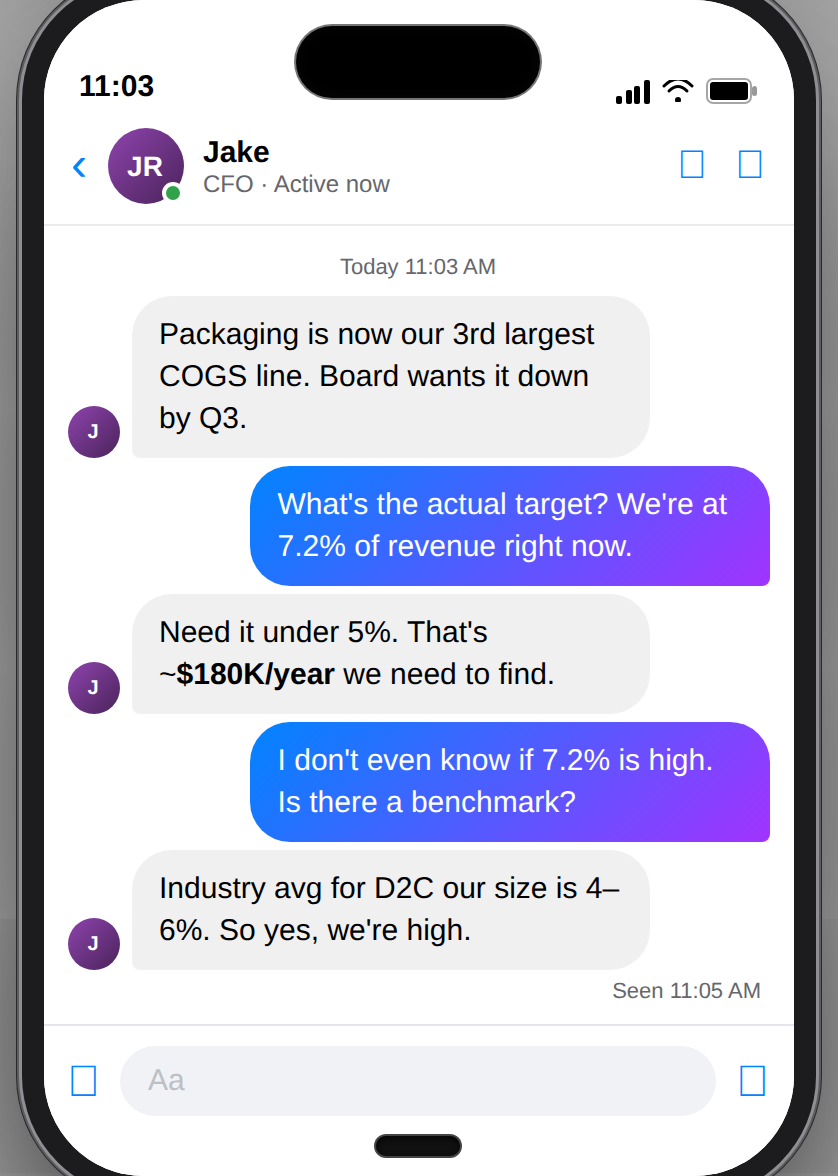
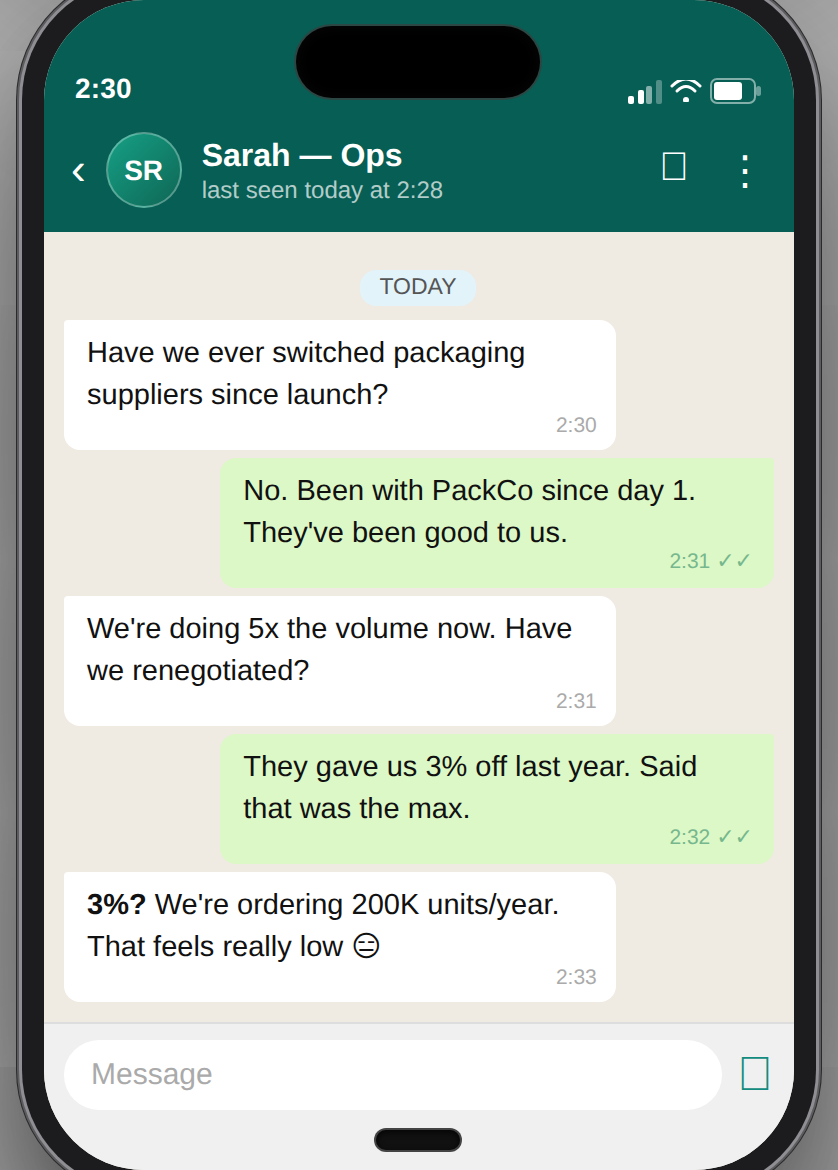
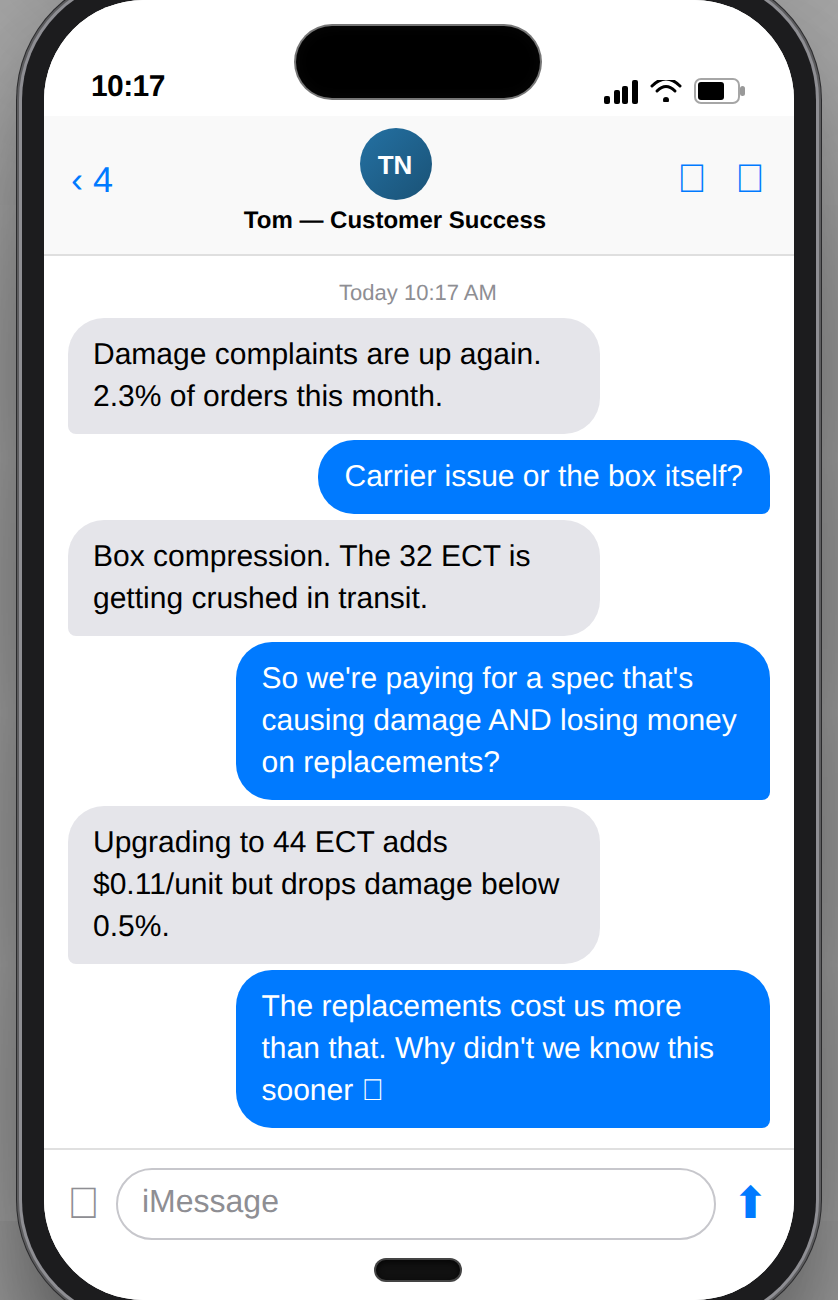
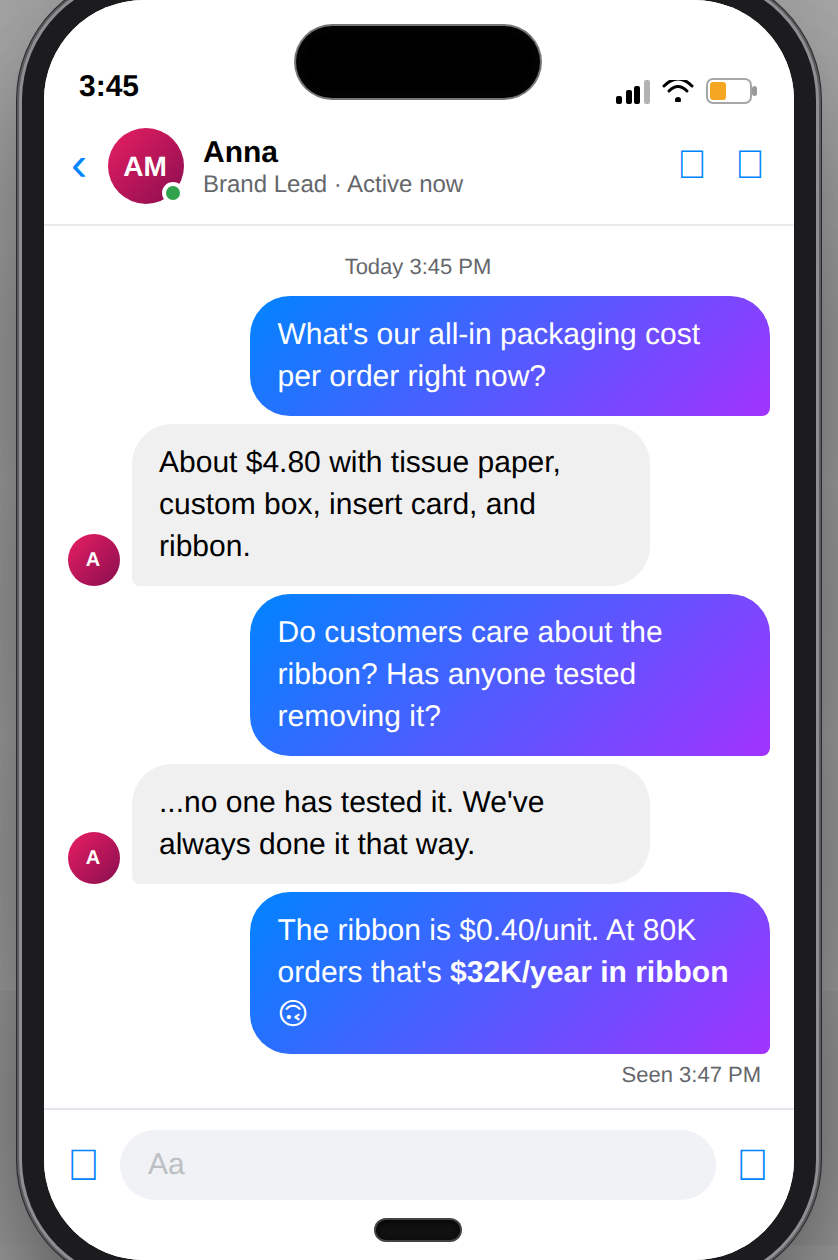
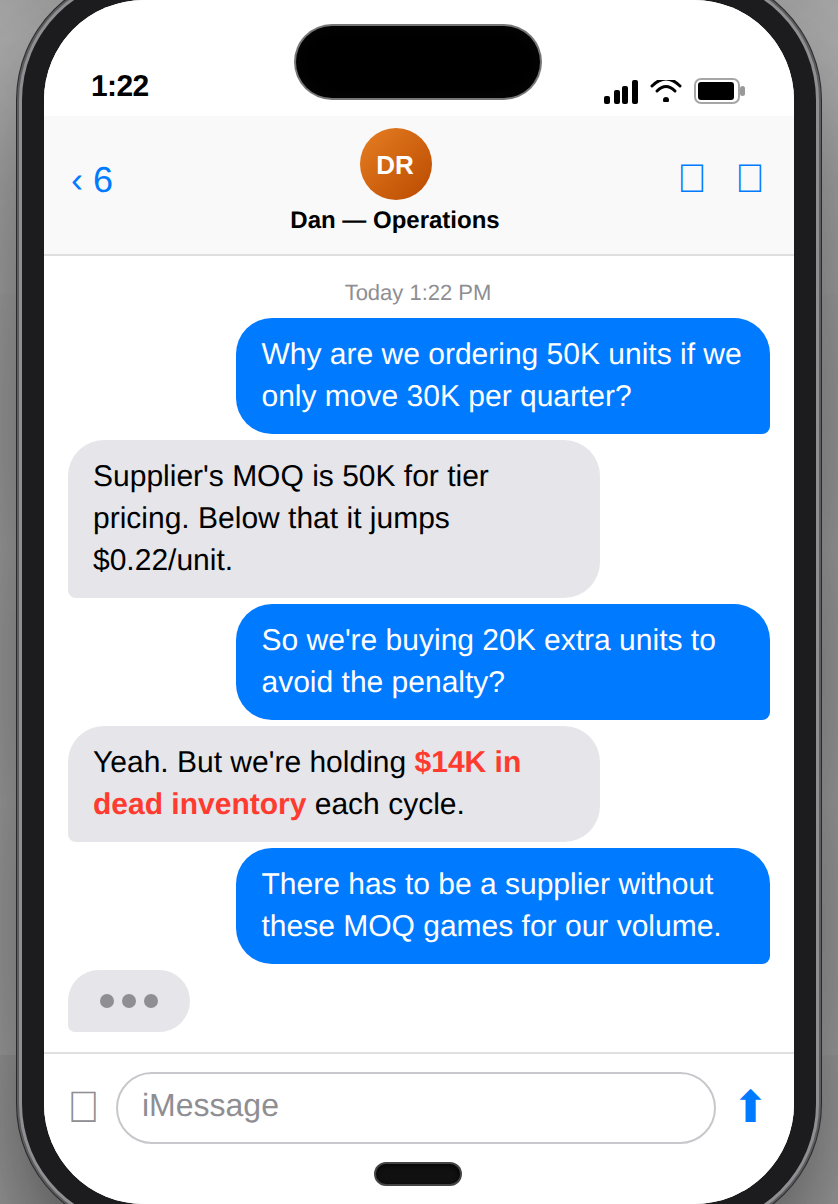
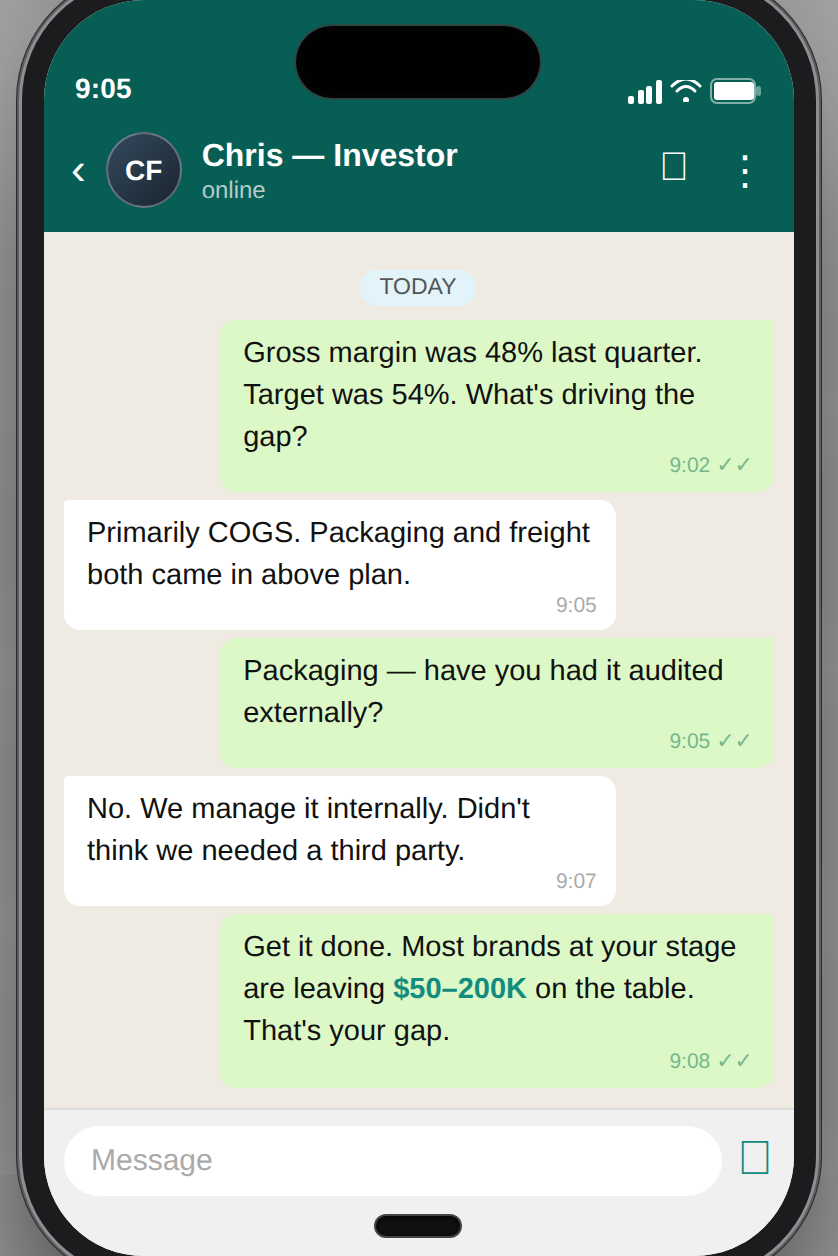
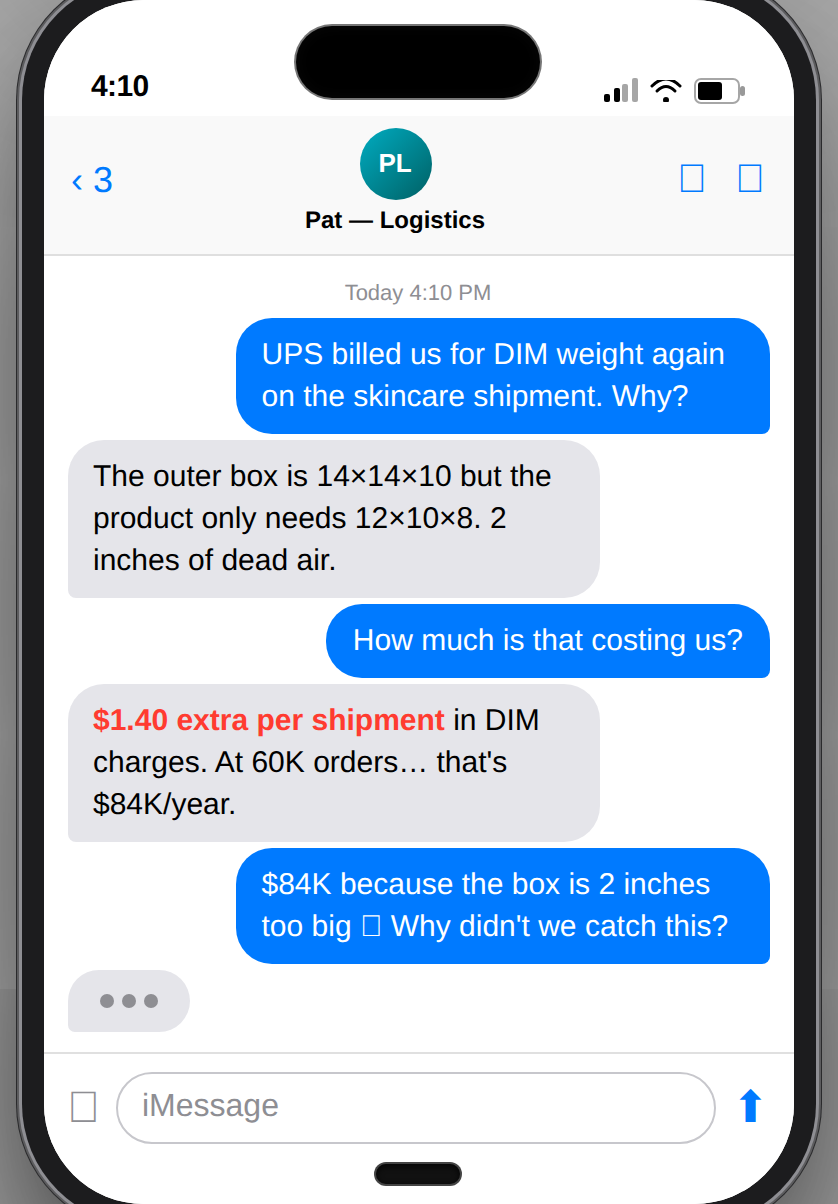
Sound familiar?
This is what we fix.
These are the conversations happening in D2C finance and ops teams right now. Each one represents tens of thousands of dollars left on the table.
Built for brands like yours.
Every D2C vertical has different packaging economics. We know exactly where the margin hides in yours.
Beauty & Skincare
Custom jars, pumps, and rigid boxes eat 25-40% of COGS
Supplements & Wellness
MOQ traps lock $60K+ in slow-moving bottle inventory
Food & Beverage
Freight costs buried in CIF terms hide 20-30% markup
Home & Lifestyle
Over-engineered inner packaging adds $1-3 per unit unnecessarily
Pet Products
Heavy bags and rigid packaging inflate DIM weight charges
Fashion & Accessories
Premium unboxing costs balloon at scale — poly mailers save 70%
Not listed? We work with any D2C brand spending $100K+ on packaging.
Get Free AssessmentFrom scan to savings in 45 days.
No 6-month consulting engagement. No vague recommendations. A clear process with defined deliverables and measurable outcomes at every step.
Calculate Your Margin Leakage
Three quick questions about your packaging spend, ordering cadence, and freight setup. Three minutes. No commitment.
Free — no obligationReceive Your Margin Diagnostic
We benchmark your supply chain against current market data and identify exactly where and how much you're leaking — broken down by category.
Detailed report in 48 hoursWe Recover the Margin
Our team renegotiates supplier pricing, restructures freight, optimizes MOQs, and improves credit terms. Measurable results in 45 days.
Performance-based — we win when you winReal brands.
Real numbers.
"We thought our supplier pricing was competitive — we'd been with the same factory for 3 years. Margin Lab showed us we were 14% above market. They renegotiated three contracts in 30 days and we recovered $84,000 in the first year alone."
"Our MOQ was set by inertia — we just kept ordering what we always ordered. Margin Lab cut our order size by 40%, reduced the unit cost premium, and freed up $60K in working capital we redeployed into paid acquisition."
"The diagnostic was genuinely eye-opening. We were using air freight for 40% of our shipments reactively because our replenishment cycle was broken. After restructuring, freight costs dropped 22% in 60 days."
"I was skeptical — we'd already 'optimized' our supply chain with a consultant two years prior. Margin Lab found $47K in leakage that consultant missed, mostly in payment terms and freight structure."
"The performance-based model was what convinced me. If they don't find savings, we don't pay. Within 45 days we had $31K in verified savings and a roadmap for another $58K over 12 months."
"Pre-Series A, every margin point mattered for our fundraise narrative. Margin Lab improved our gross margin from 52% to 61% in one quarter. That single data point changed our investor conversations entirely."
Inside three
real engagements.
Every number below is verified. These are detailed breakdowns of what we found, what we changed, and what it meant for each business.
Lumière Skincare
From supplier loyalty to supplier leverage.
Lumière had worked with the same packaging supplier for 3 years. They assumed the relationship meant good pricing. It didn't.
- ✕Unit costs 14% above current market benchmark
- ✕MOQ of 5,000 units vs. optimal 2,500 — $38K tied in excess inventory
- ✕Paying 30% deposit upfront when Net-30 was standard in the category
- ✕No secondary supplier — zero negotiation leverage
- ✓Benchmarked against 6 comparable suppliers in the same category
- ✓Introduced a secondary supplier to create competitive tension
- ✓Renegotiated pricing on 3 core SKUs using competitive quotes
- ✓Extended payment terms from upfront to Net-45
- ✓Reduced MOQ by 50% with rolling purchase commitment
"We'd been paying a loyalty tax for 3 years without knowing it. The audit paid for itself in the first week."
— Sarah K., Founder
Peak Nutrition
Turning frozen cash into acquisition budget.
Peak Nutrition was ordering quarterly in large batches to hit MOQ pricing — but their forecasts were off and inventory was sitting for 90+ days.
- ✕Average inventory age: 94 days vs. a 30-day target
- ✕7% unit cost premium vs. brands ordering at optimal frequency
- ✕$60K+ in working capital tied up in slow-moving packaging
- ✕Air freight used 3× in 12 months due to stockout overcorrections
- ✓Recalculated optimal order frequency based on actual sell-through data
- ✓Negotiated MOQ reduction from 10,000 to 4,000 units with volume guarantee
- ✓Implemented 8-week rolling forecast model for reorder triggers
- ✓Eliminated reactive air freight through improved replenishment planning
"We didn't have a packaging problem — we had a forecasting problem destroying our packaging economics. Margin Lab saw that immediately."
— James T., COO
Groundwork Coffee
Nine gross margin points before the Series A.
Pre-Series A with investor scrutiny on unit economics, Groundwork needed to improve gross margin without compromising the packaging quality central to their brand.
- ✕CIF freight terms — supplier controlled all freight procurement
- ✕Each SKU shipped independently — no consolidation
- ✕Inner packaging over-engineered beyond consumer visibility
- ✕Paying market rate where volume discounts were available
- ✓Switched from CIF to FOB — took direct control of freight
- ✓Consolidated 4 shipment lanes into 1 monthly container
- ✓Rationalized inner packaging spec — same protection, 18% less material
- ✓Negotiated tiered volume pricing unlocked at current annual spend
"Our Series A deck went from 52% to 61% gross margin in one quarter. That single change shifted how investors saw our business."
— Tom W., Co-Founder
Want to know if your numbers look like these?
Get Free AssessmentYou only pay when we deliver savings.
Every engagement starts with a free assessment. No upfront fees, no commitments — just a clear picture of your savings potential.
Free packaging assessment
We analyze your supply chain and show you exactly where margin is leaking — at no cost.
Performance-based model
No savings, no fee. We earn only when you see verified results on your bottom line.
Results in weeks, not months
Average client sees first verified savings within 37 days of engagement.
Common questions.
Find out exactly how much
you're leaving on the table.
The Margin Leak Scanner takes 3 minutes. Get a breakdown of your annual leakage by category, your savings potential, and a clear next step. No cost. No commitment.
Free · 3 minutes · No credit card required